Developing a Trading Algorithm
This article will briefly cover the process of developing a trading algorithm, from the birth of an idea to launching the algorithm into "battle."
Finding an Idea
First, you need an idea for the algorithm. There is a wealth of underestimated ideas in open sources that can be exploited. In this article, we will consider medium-term algorithms as an example (about 250 trades per year).
Development
There is plenty of software for such tasks, for every taste. I use TSLab. To make algorithm testing results closer to reality, you can apply a condition — skip opening and closing trades during the first minute of the trading session. This is because the first minute of the trading session is often illiquid. It is necessary to set a commission. For RTS and SI, it is advisable to use a relative commission of 0.03%; for SBRF, an absolute commission of 3 points. This value should account not only for the broker and exchange commissions but also for slippage and spread. Depending on the algorithm, slippage will vary — breakout algorithms have high slippage, while trades executed at the bar close have lower slippage.
Optimization
Next, you need to optimize the parameters. At this stage, I optimize parameters on all available historical data. For TSLab users, it will be useful to know — before optimization, set the "Start from (bar)" property in the script settings to the value of the longest parameter +1. After optimization, pay attention to a couple of characteristics:
- Number of trades no less than 1000. This number of trades gives the test statistical reliability.
- Recovery factor greater than 15. This indicator is the ratio of absolute profit to maximum drawdown. It shows how quickly the algorithm recovers from a drawdown.
- No curve outliers. Sometimes the system adapts to market conditions during optimization, and the entire profitability of the algorithm is based on one significant market movement.
- Changing parameters within a range of 20% does not strongly affect the overall results.
Forward Test or Blind Simulation
The next stage is the most labor-intensive, especially for TSLab users who have to use office packages — fortunately, TSLab allows data export. Walk forward analysis (WFA) is a method for evaluating effectiveness. The method was developed by Robert Pardo and is described in detail in his book. The method involves optimizing parameters on the in sample (IS) segment and testing these parameters on the blind out of sample (OOS) segment. Simply put, the algorithm is optimized on a data segment where subsequent parts are deliberately excluded. Then the algorithm's performance is tested using the obtained parameters on the excluded data. It is recommended to conduct at least ten tests, and the OOS window should not exceed 20% of the total segment. This approach eliminates the possibility of curve-fitting to historical data because parameters are determined based on past data, not current data, and are tested on a blind zone. There are two testing methods — fixed sliding window
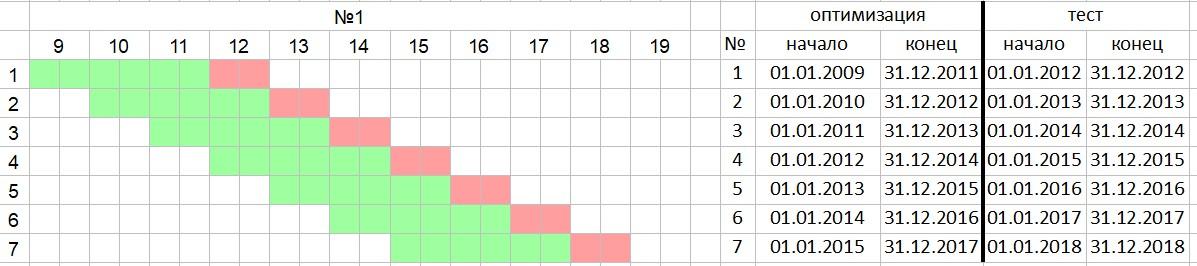 is 3 years, oos 1 year
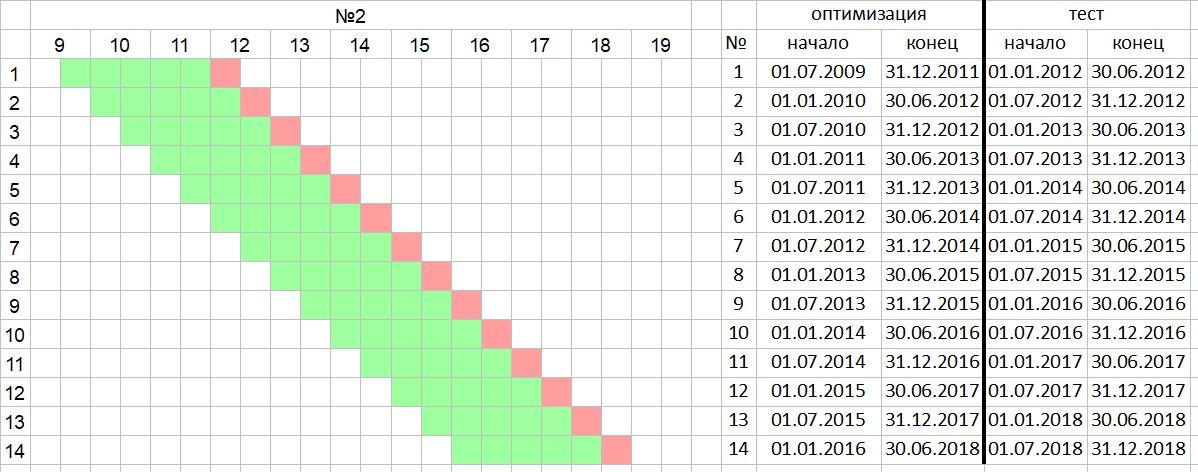 2.5 years, oos half a year
and a constantly increasing IS period.
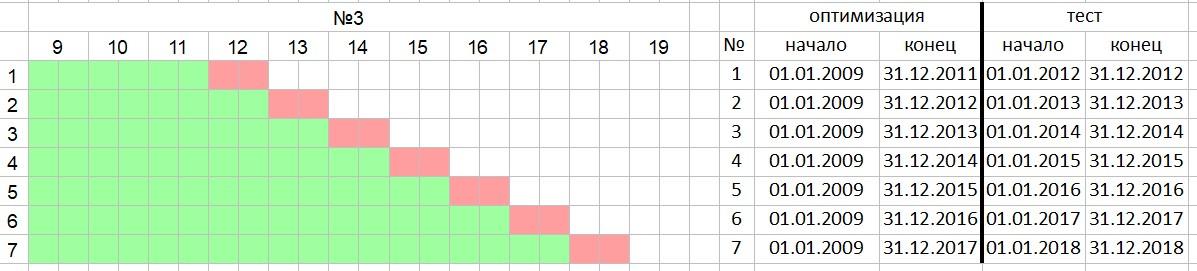 oos 1 year
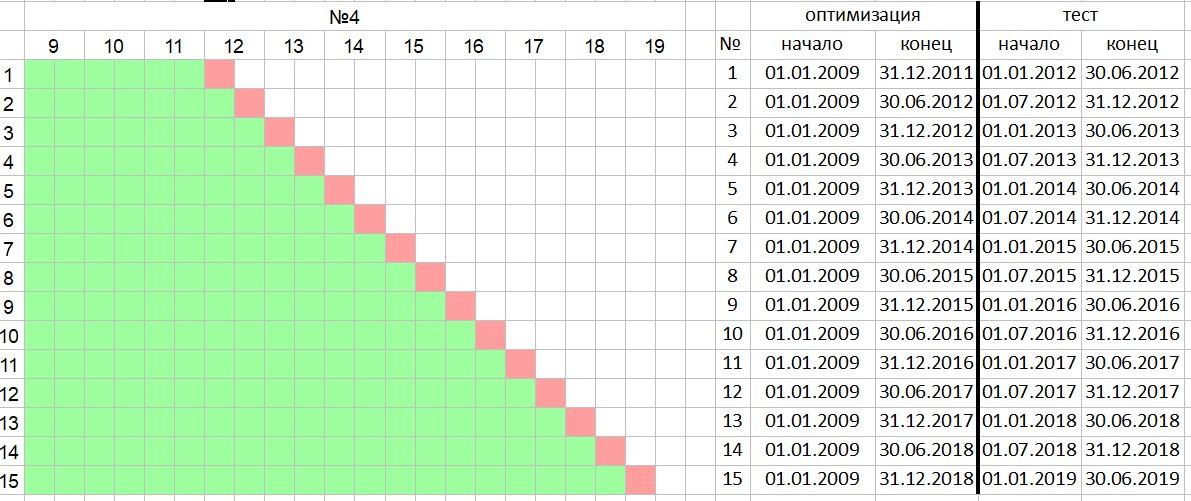 oos half a year
The fourth method shows more favorable results. I tested four algorithms and compared the sum: wfe (Ewfe), ratio drawdown (Erdd) and the ratio: wfe-ratiodd (Erwd), Ewfe-Erwd and Ewfe-Erdd (R f-g)
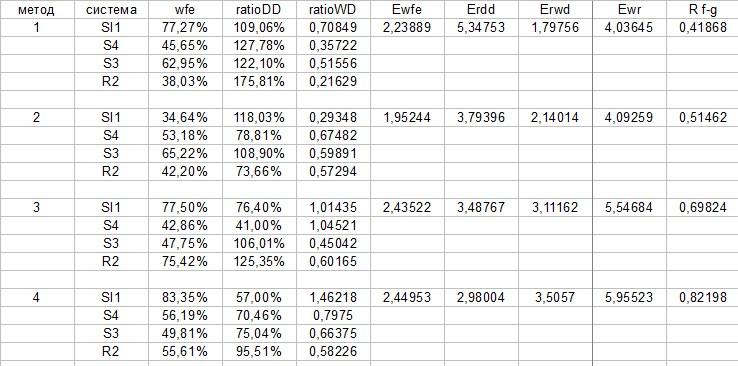
I agree that the very fact of choosing a testing method is already a form of curve-fitting, but the goal is to find the most reliable method without looking into the future. The method has a right to exist. The most important characteristics at this stage are:
- Walk forward efficiency (WFE, the ratio of average annual profit oos to is) forward efficiency indicator above 50%
- Most tests show a profit
- Average Ratio drawdown values below 100%
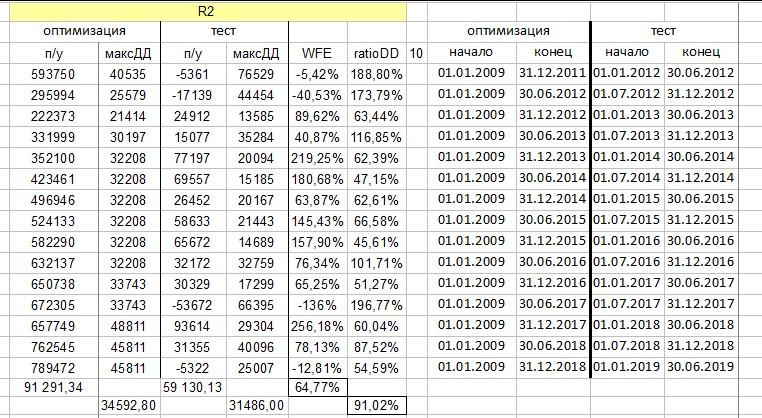 Example of one of the algorithms. WFE 64.77, ratioDD 91.02
As we can see from the example above, the algorithm shows a profit at 64% of the optimization segment — this seems plausible. The average drawdown indicator at 91.02% is also acceptable, but if you look at the maximum value, it's quite possible that the real drawdown could be double the drawdown on the optimization segment.
The entire process analyzed above is not a guarantee of success, only a way to predict the algorithm's future performance, and by no means the only method.
Interesting materials:
Curve-fitting and other methods of parameter selection
On the subject of optimization